Identifying Vulnerable Populations Through Data-Driven Insights

In short
A Flemish health insurance company approached us with a crucial question:
can environmental and demographic factors help identify vulnerable populations at a municipal level? To answer this, we combined publicly available data with advanced analytics and machine learning to uncover the key drivers of vulnerability across Flemish municipalities.

“ Our focus was on long-term value, not a one-off proof of concept. By building a reusable analytics architecture in Databricks and Power BI, the client can now plug in internal data and continuously generate new insights.“
Yorick – consultant at Searching Pi
Content of the article
- How a comprehensive, municipality-level dataset was built by combining publicly available indicators with health-related vulnerability measures.
- How scalable data architecture and machine learning models were used to predict vulnerability and uncover its key drivers
- How complex analyses were translated into actionable insights through clear visualizations and stakeholder-friendly dashboards
Building a comprehensive dataset
We started by constructing an extensive dataset at the municipality level, using publicly available data from the Gemeente-Stadsmonitor. This dataset included over 100 environmental and demographic factors, such as air quality, education levels, and socio-economic indicators.
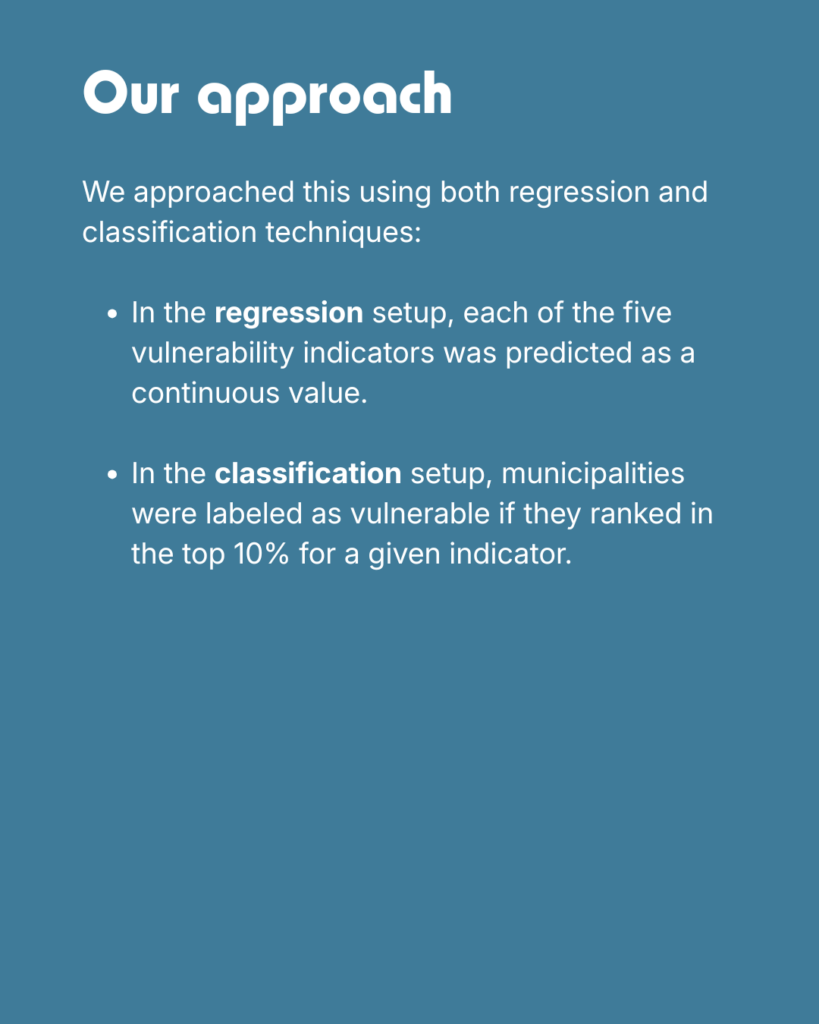
To quantify vulnerability, we relied on five health-related indicators sourced from the Intermutualistic Agency (IMA):
- Prevalence of chronic obstructive pulmonary disease (COPD)
- Use of antidementia medication
- Use of antidepressants
- Use of antipsychotics
- Prevalence of polypharmacy
Together, these indicators provided a robust proxy for population vulnerability.
Details on the data architecture
Scalable data architecture and processing
To manage and process this data efficiently, we implemented a Databricks environment using a Medallion Architecture (bronze, silver, and gold layers), allowing for incremental improvements in data quality and usability.

Exploring relationships between indicators
Before building predictive models, we performed an exploratory analysis to better understand the relationships between environmental, demographic, and health-related indicators. As part of this step, we generated a correlation matrix across all available factors.
This analysis provided early insights into:
- Strongly correlated environmental and demographic variables
- Potential multicollinearity among predictors
- Initial signals of which factors might be associated with higher vulnerability
The correlation matrix helped guide feature selection and informed the interpretation of the machine learning results, ensuring that model-driven insights could be contextualized within broader statistical relationships observed in the data.
Machine learning approach
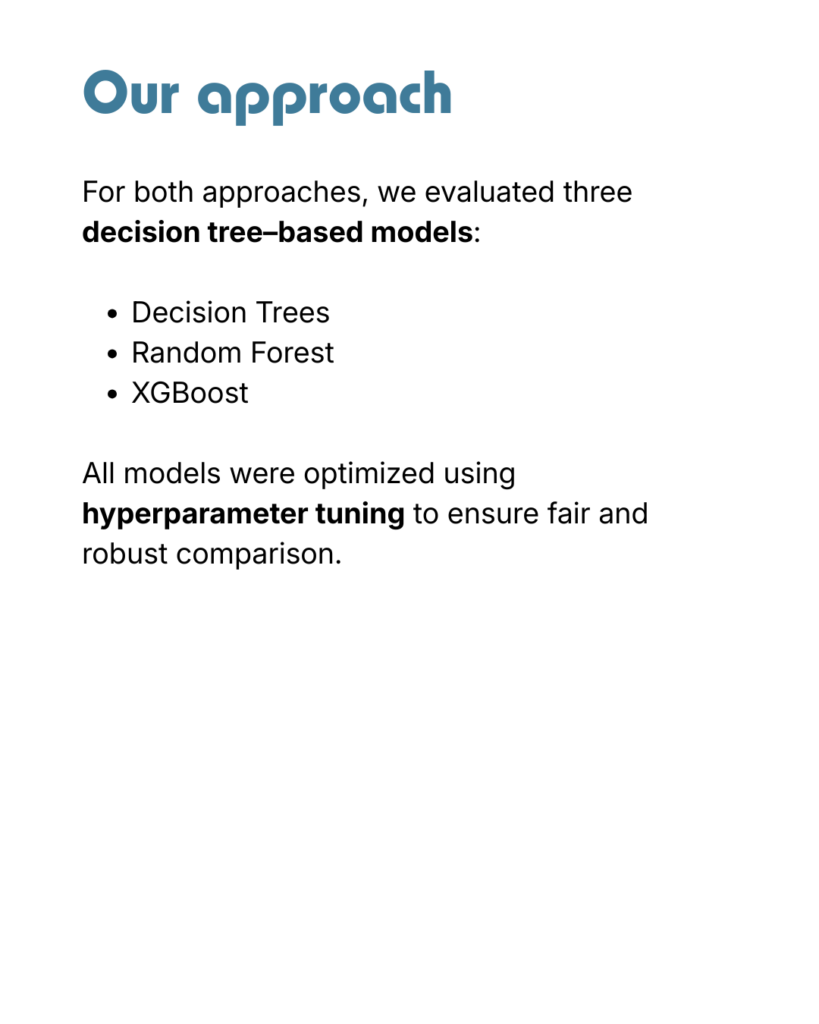
Explaining vulnerability drivers
Since interpretability was a key requirement, we used permutation importance to quantify the impact of each factor. This method measures how much model performance changes when a single variable is altered, allowing us to identify which environmental and demographic characteristics contribute most to vulnerability.
From analysis to actionable insights
To make the results accessible to non-technical stakeholders, we delivered the insights through an interactive Microsoft Power BI report. The dashboard enables:
- Exploratory analysis of vulnerability indicators
- Comparison between municipalities
- Model performance comparison
- Clear visualization of the most influential vulnerability drivers
This allowed the client to move from raw data and complex models to actionable, policy-relevant insights.

